

Hey everyone,
Ever heard of Monte Carlo Simulations? It sounds fancy, but it’s actually a straightforward way to deal with uncertainty in financial models. The idea behind it is simple – when we’re unsure about certain inputs (like future sales, interest rates, or costs), we can run thousands of “what if” scenarios to get a better sense of possible outcomes. It’s kind of like rolling dice repeatedly and then figuring out what happens on average. The name comes from the famous Monte Carlo casino in Monaco, where games of chance and probabilities reign supreme. It was first developed by mathematician Stanislaw Ulam during World War II while working on nuclear weapons research. But today, we use it to solve all kinds of problems!
Monte Carlo Simulations are great for any situation where the future is uncertain (which is basically everything in finance). You can use them to forecast cash flows, estimate risk, or even figure out best pricing strategies. The cool part is that you don’t need to be a math whiz (I’m certainly not) to make them work – you can set up these simulations right in Excel and let the software do the heavy lifting.

Let’s take a look at how this works in Excel.
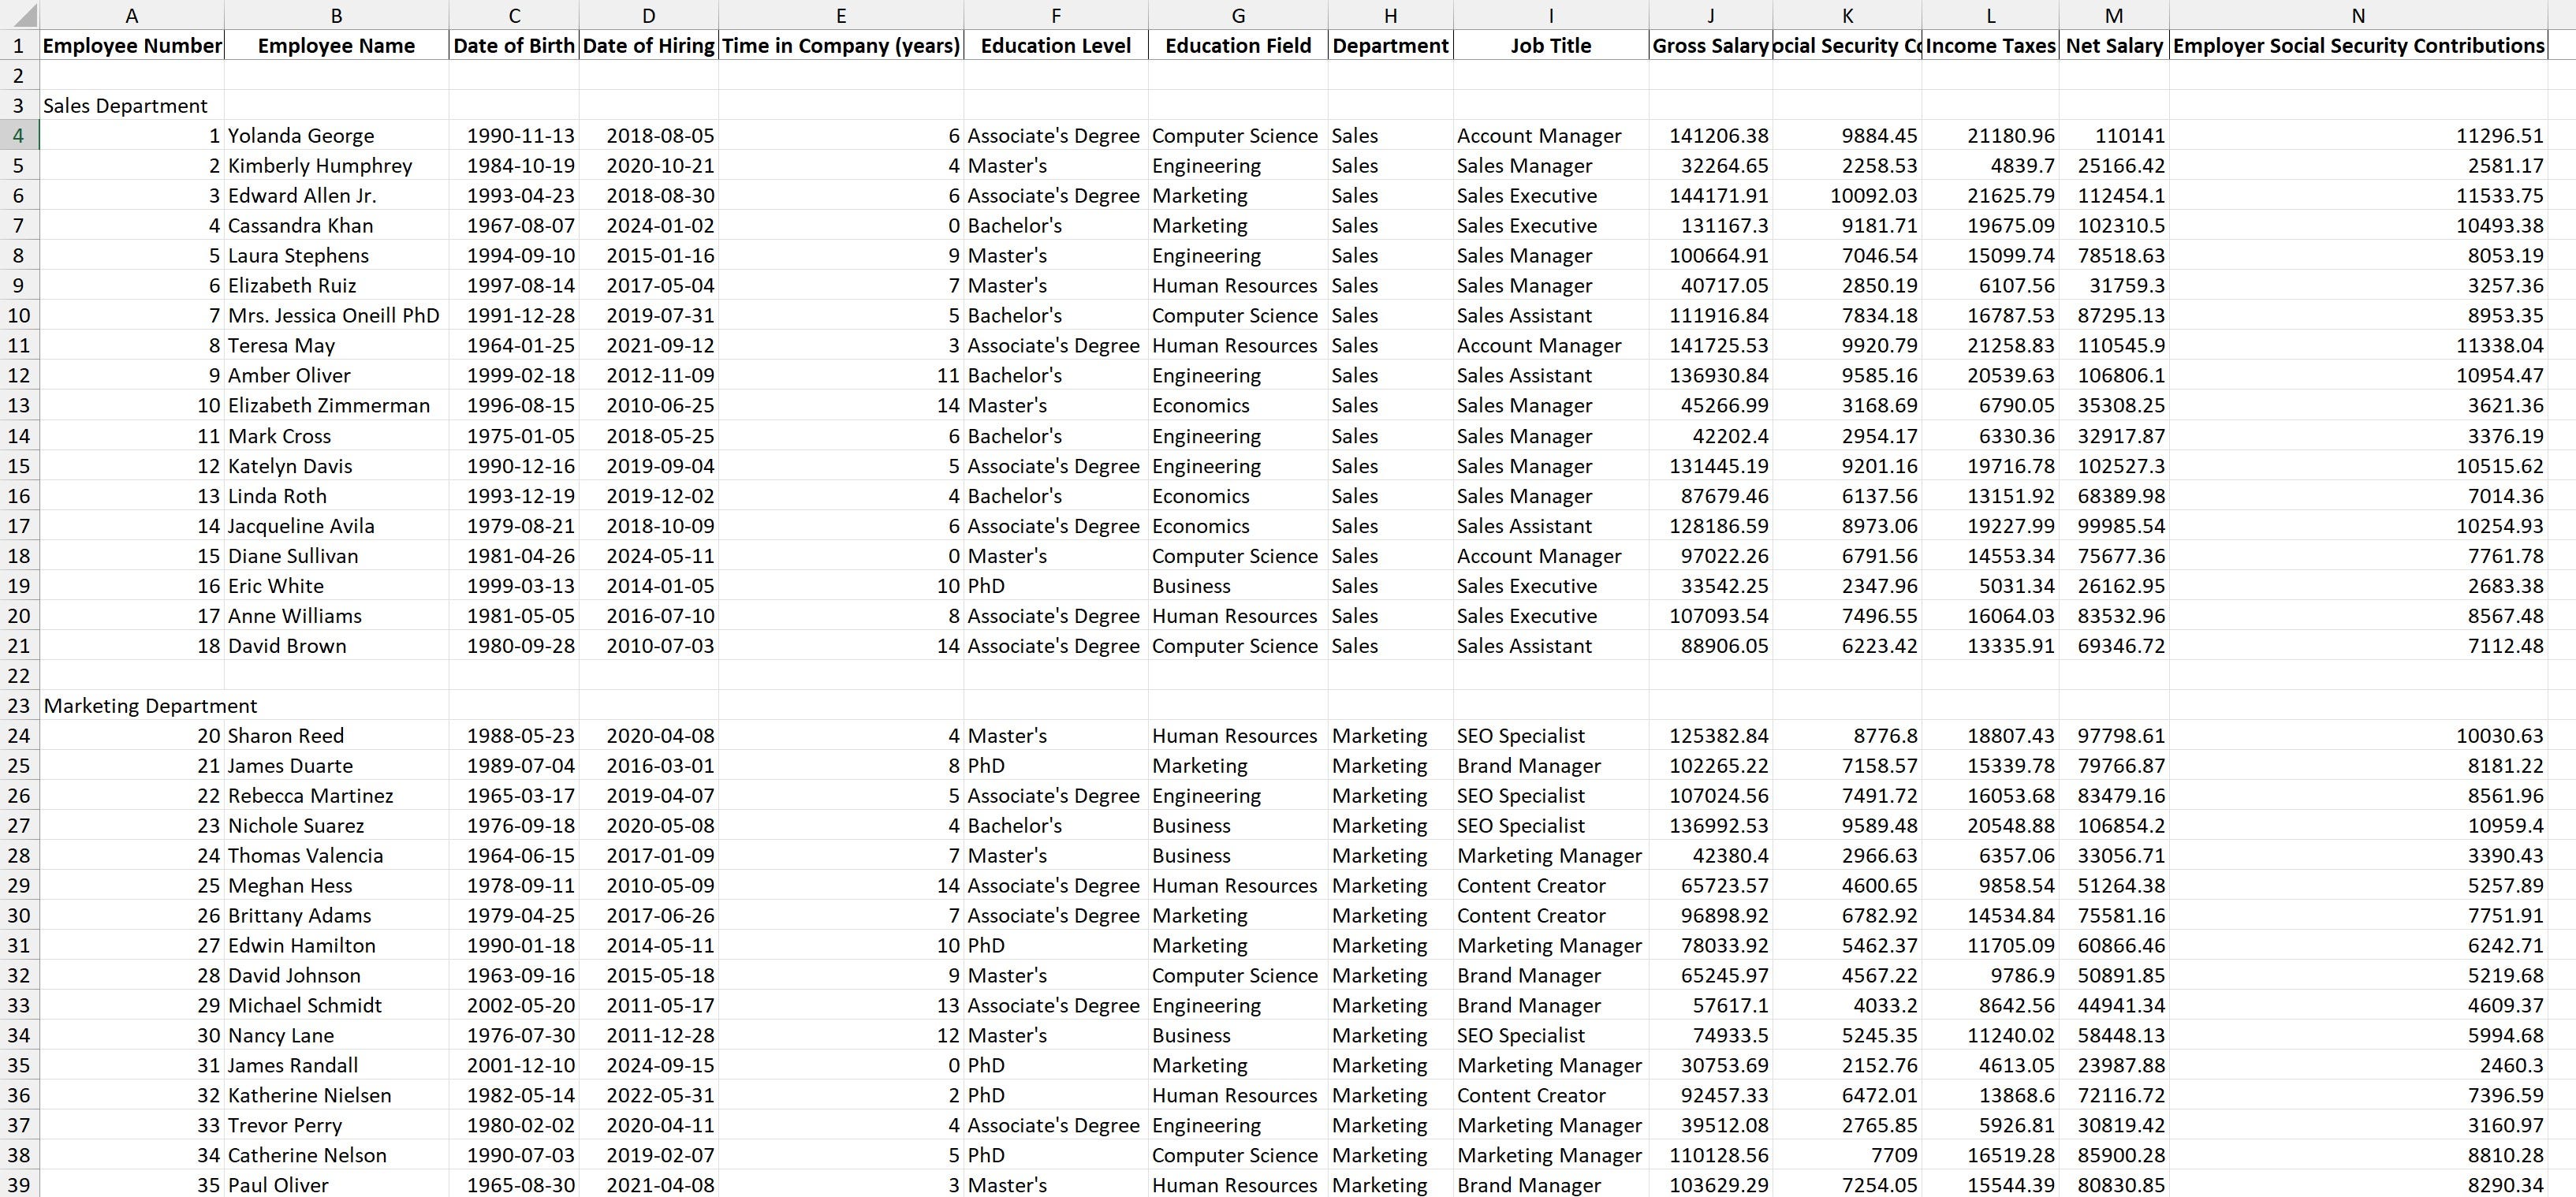
I went ahead and asked ChatGPT to generate some dummy data for a list of employees. Don’t pay attention to the salaries as they don’t make a lot of sense. The entire idea is to have some data to play with.
The scenario is as follows.
The industry where our imagined company operates is struggling and we are getting less orders. We expect this to last a few months, so we don’t want to let people go and have to rehire soon. Therefore, we want to decrease the work hours and salary for employees for the duration of the industry downturn.
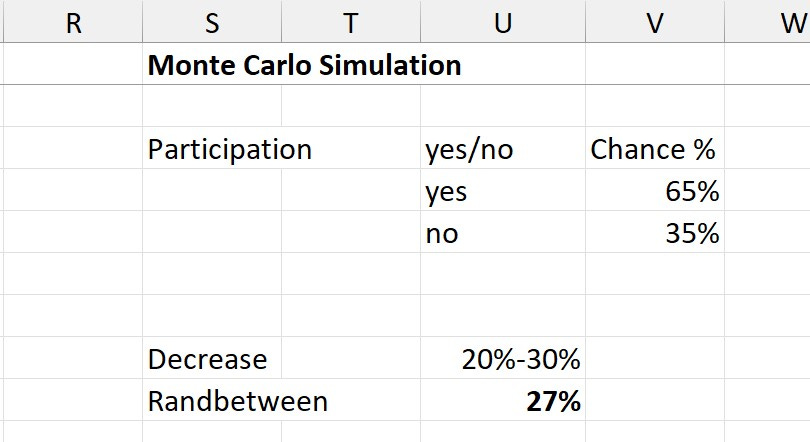
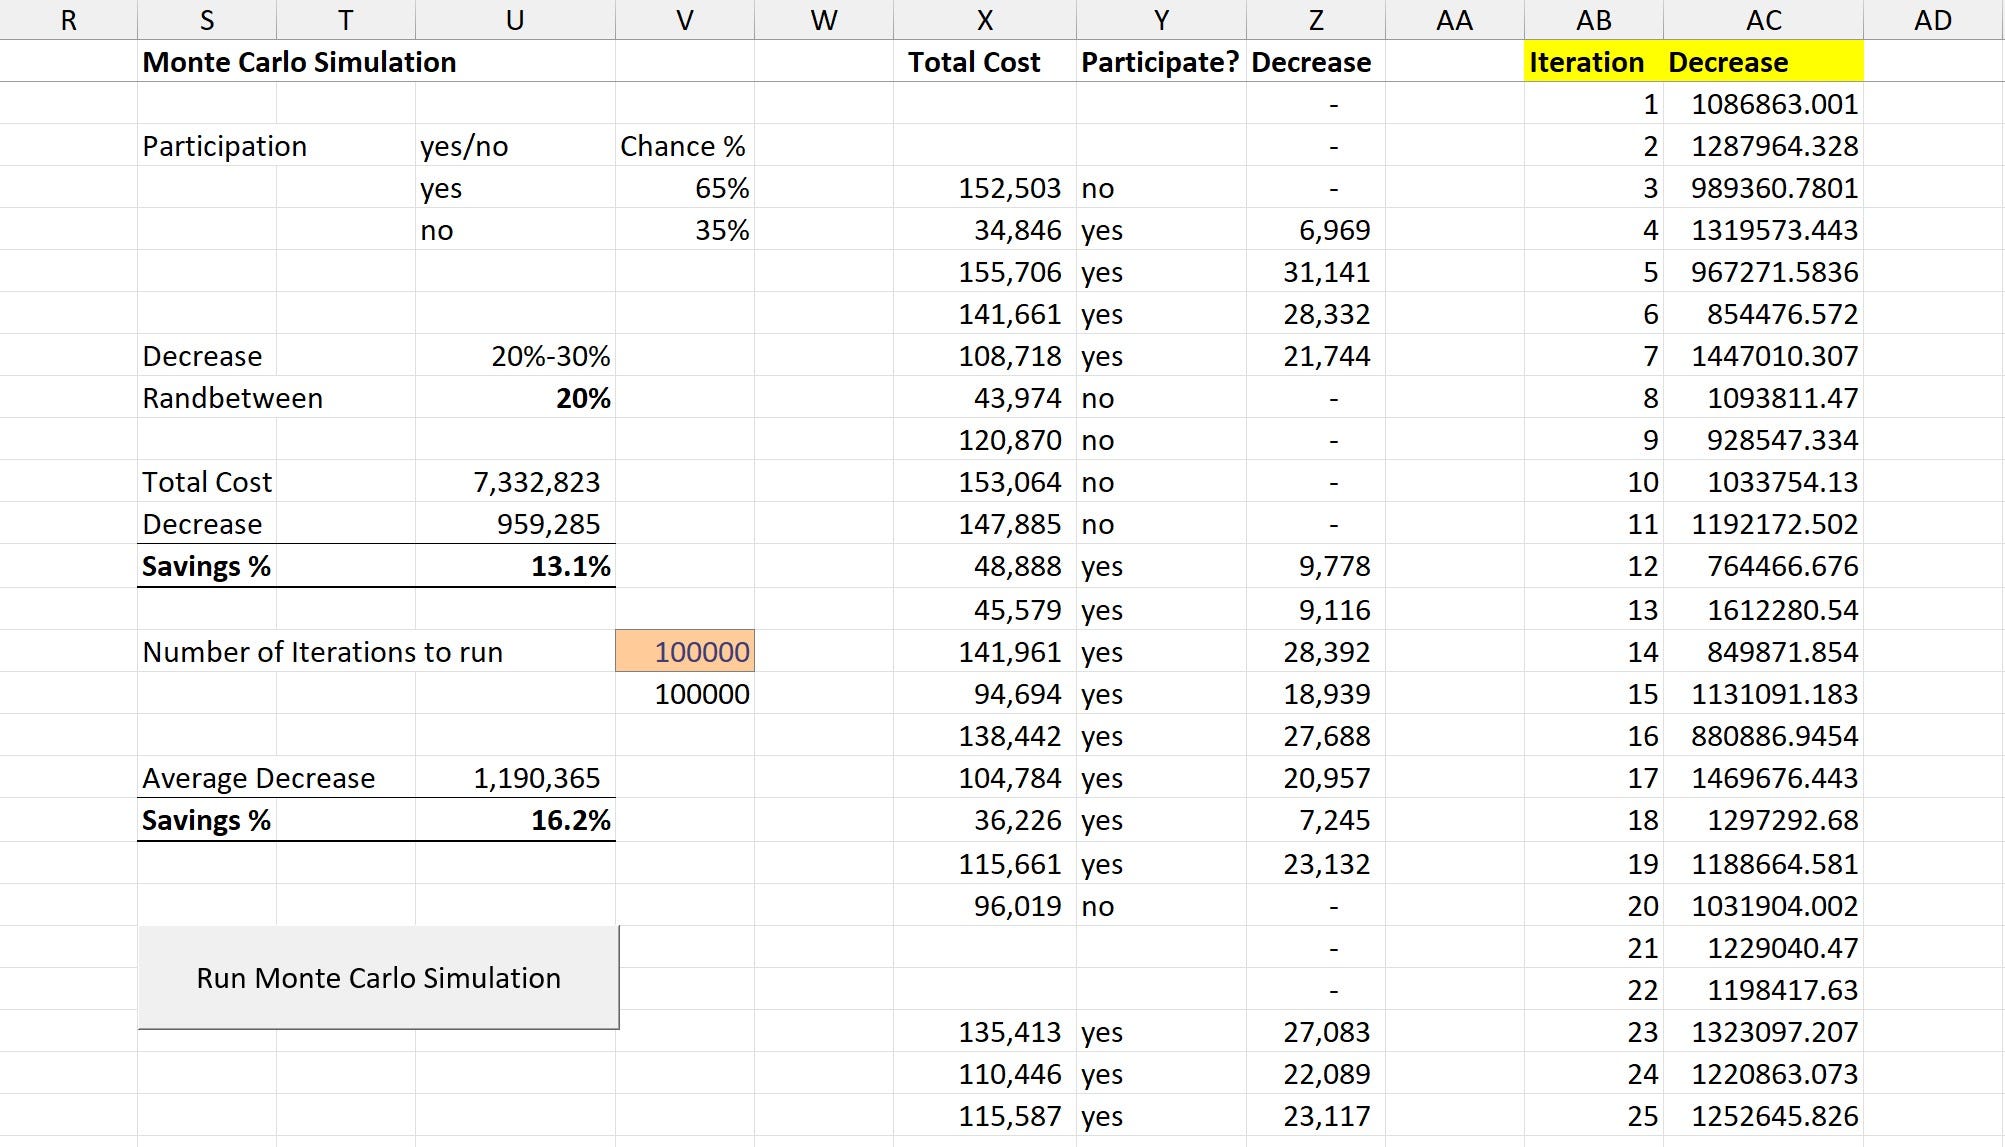
And to estimate the potential savings from this program, we will employee a Monte Carlo Simulation. We have two variables – participation and decrease %. We assume that 65% of the employees will say ‘yes’ and agree to take a cut to help us weather the storm. We expect the cut to be between 20%-30% in work hours and total employee costs (salary + employer contributions). We will use the RANDBETWEEN function in Excel to calculate a random % of decrease.
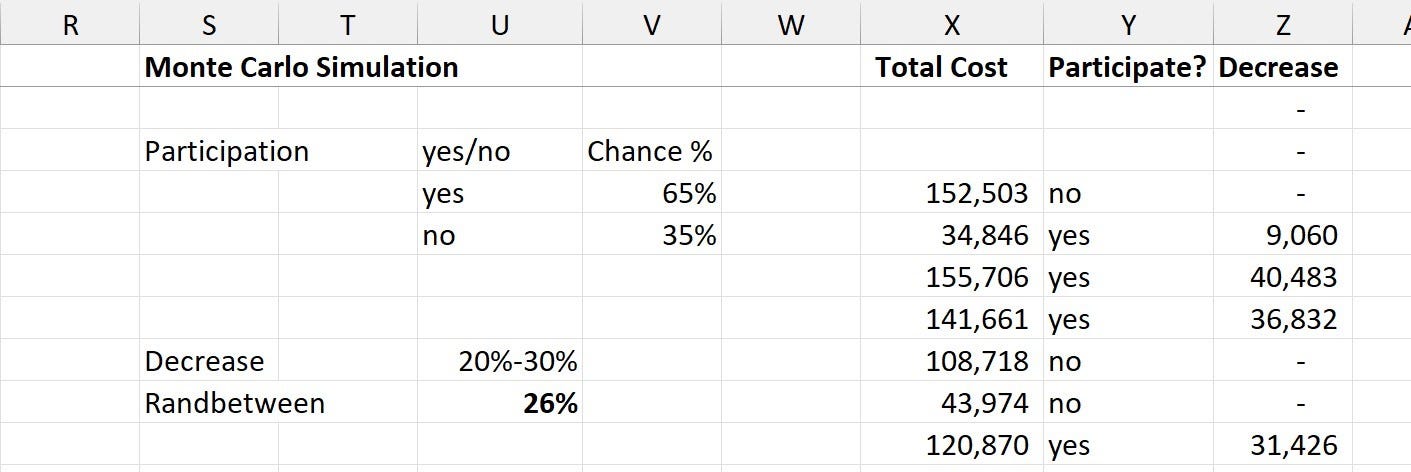
We can then add 3 more columns to the side. For each employee from our dummy dataset, we will calculate the Total Cost, whether they will Participate, and the Decrease we will get from their employment costs if they do.
For the Total Cost we simply add the Gross Salary and the Employer Contributions.
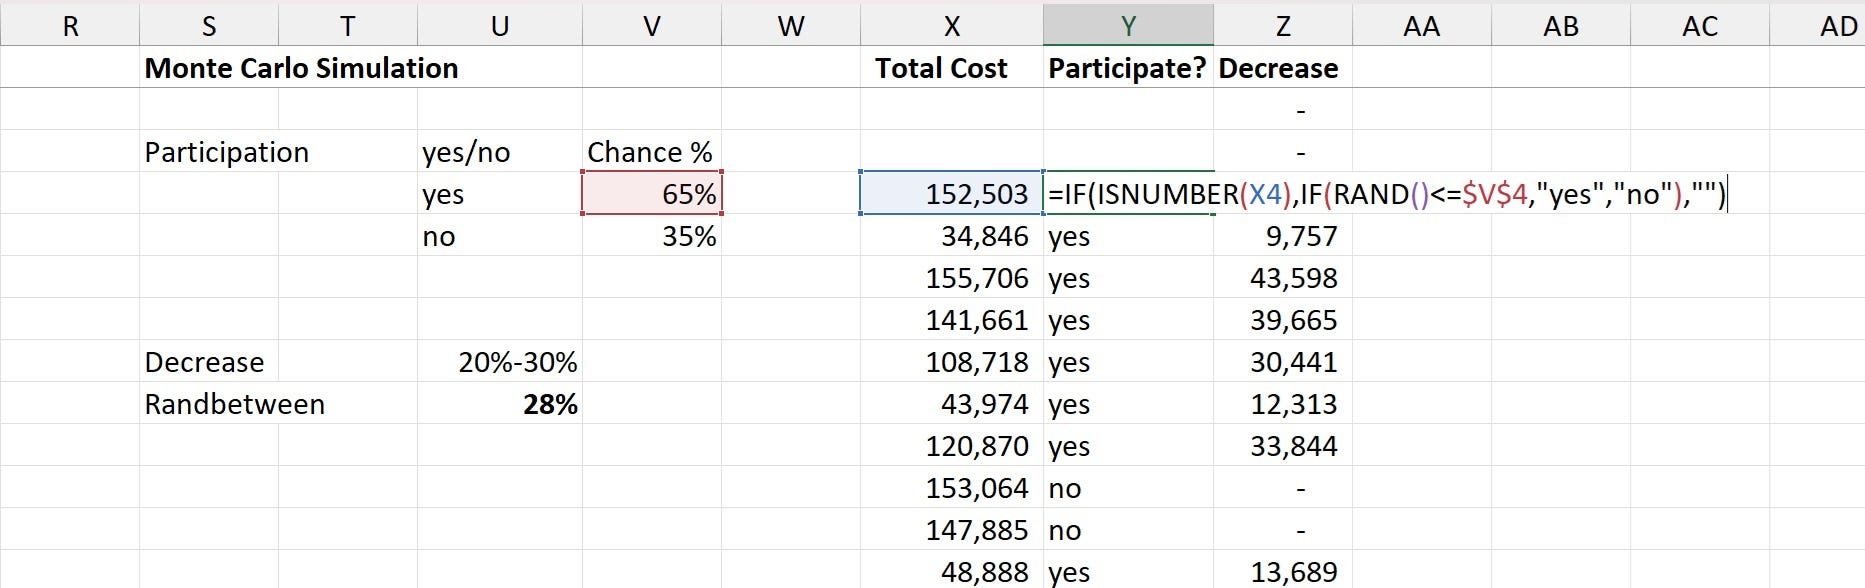
For the Participate? Column we calculate a random value between 0 and 1 with the RAND function, and for each row where we have Total Cost, we compare this random value to the 65% chance of saying ‘yes’. If the random value is between 0 and 0.65, the employee will agree to the program.
For the Decrease, we check if the employee’s response is ‘yes’ and if it is, we calculate the decrease by multiplying the Total Cost per the random decrease we calculated earlier.
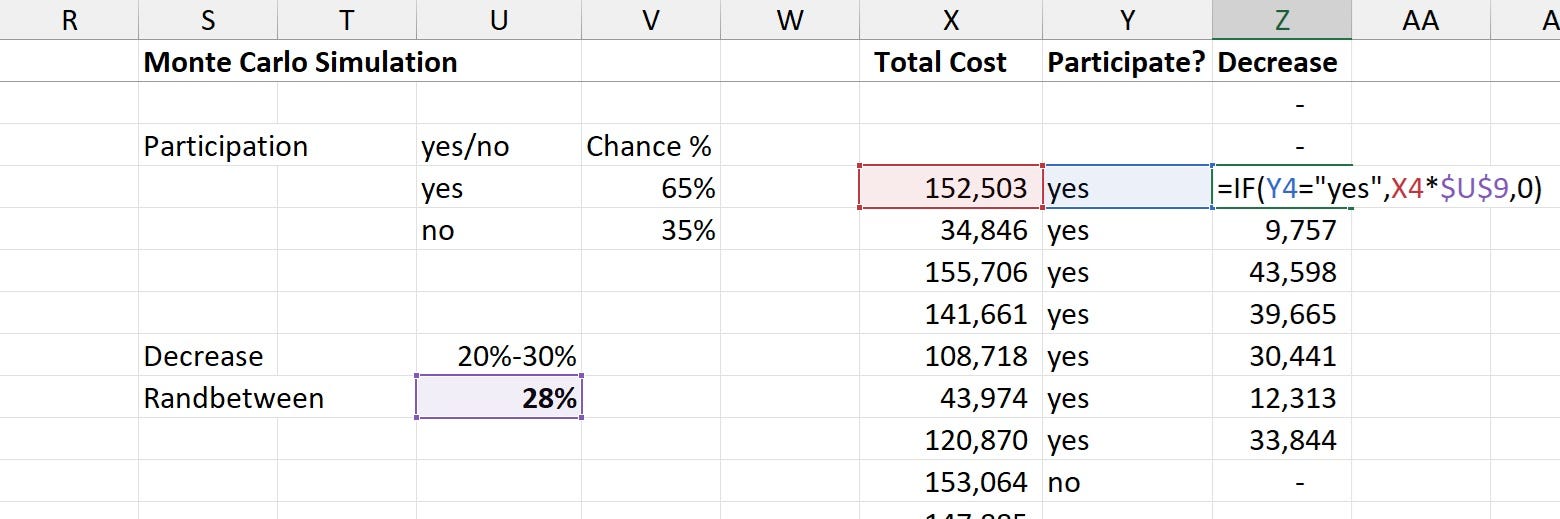
By now, you probably noticed that all random values we use (RAND and RANDBETWEEN) are changed every time the worksheet recalculates. This happens whenever we edit/enter values. We can also recalculate with the F9 key.
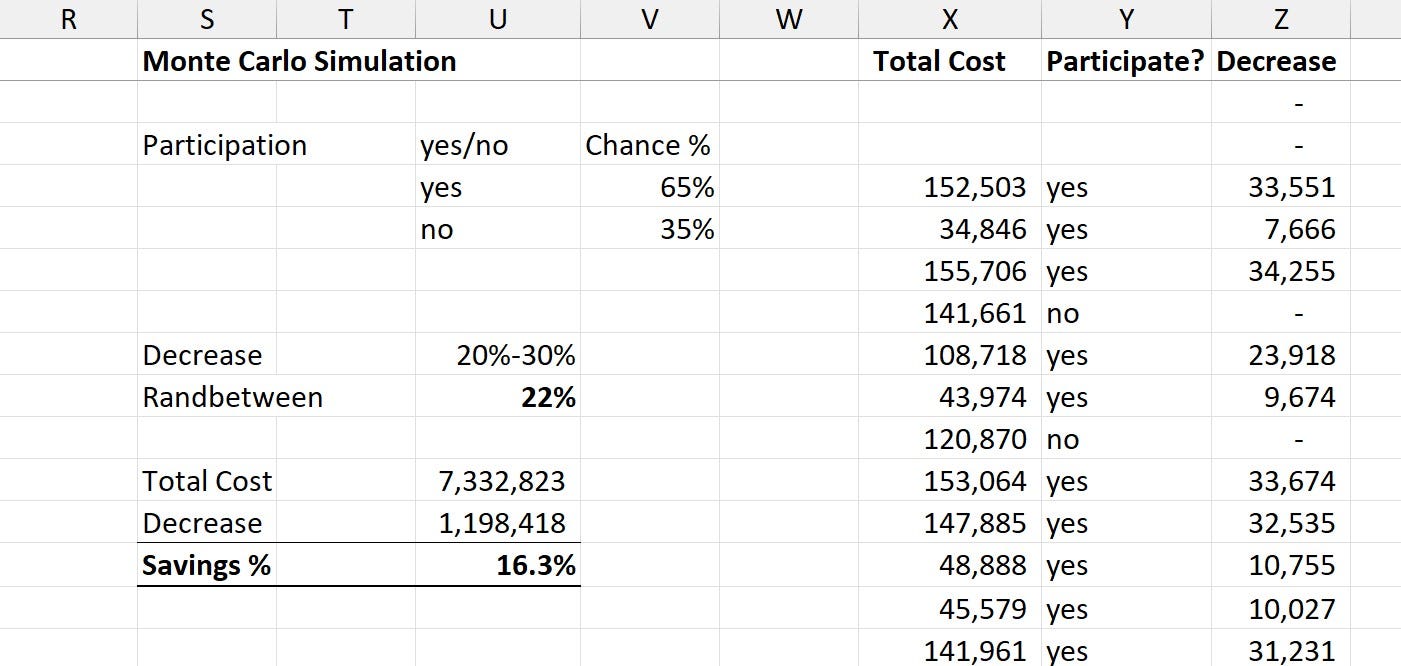
Here we have a 16.3% savings (Total Decrease / Total Cost).
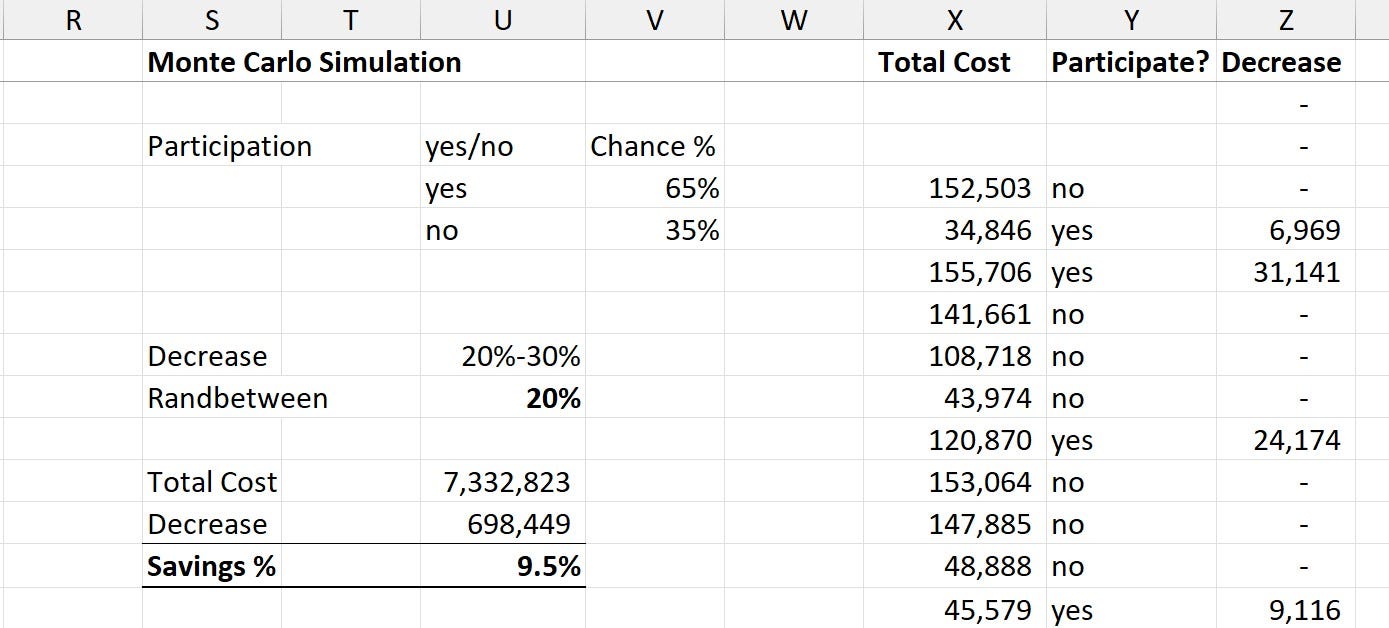
A few F9 hits and we now have a 9.5% decrease.
A few more, and it’s now 21.8%.
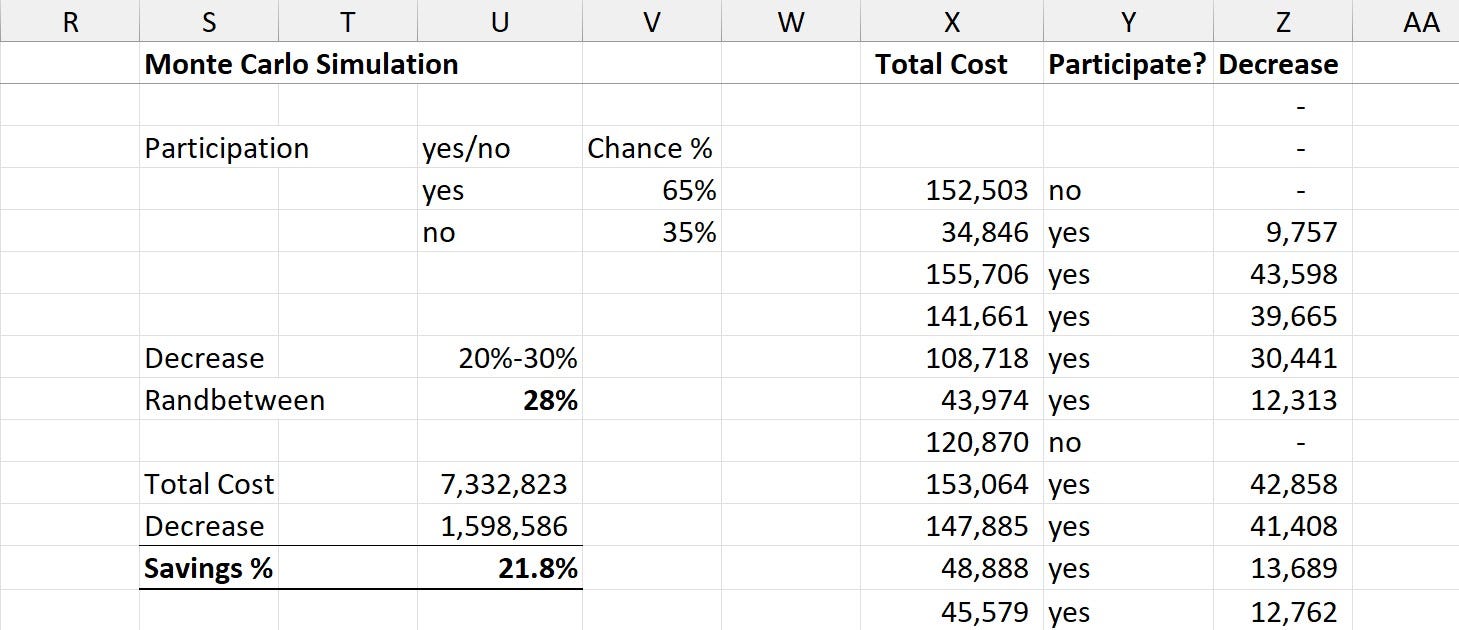
As you see, modeling for uncertainty can lead to huge swings and a potentially misleading result. Therefore, we will employ the Monte Carlo Simulation method.
Let’s add two more columns – Iteration and Decrease. We will also add a Number of Iterations to run input cell and calculate the average of the Decrease column.
We will also add a button from the Developer tab (if you don’t have the Developer tab enabled, right-click on the ribbon tabs, click on Customize the Ribbon and then add it on the right side of the window that opens up).
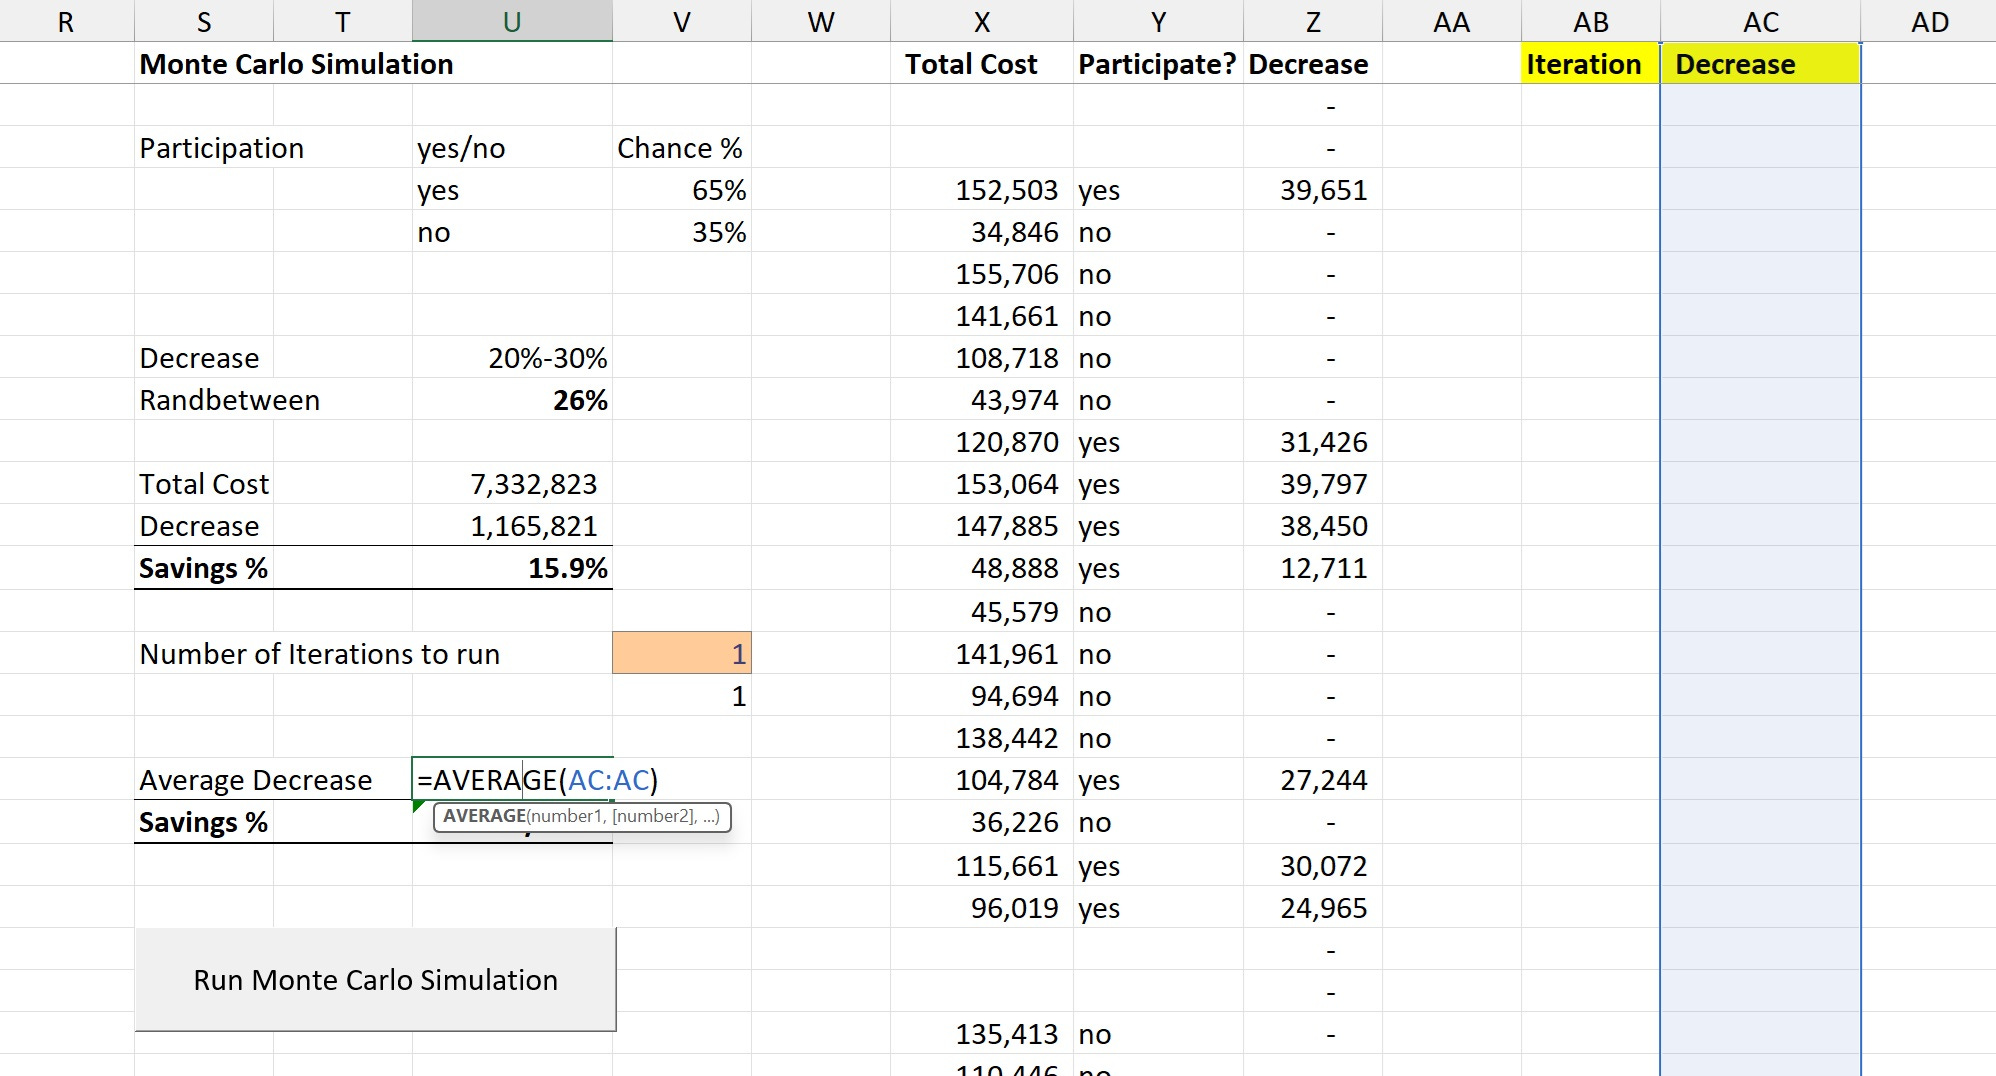
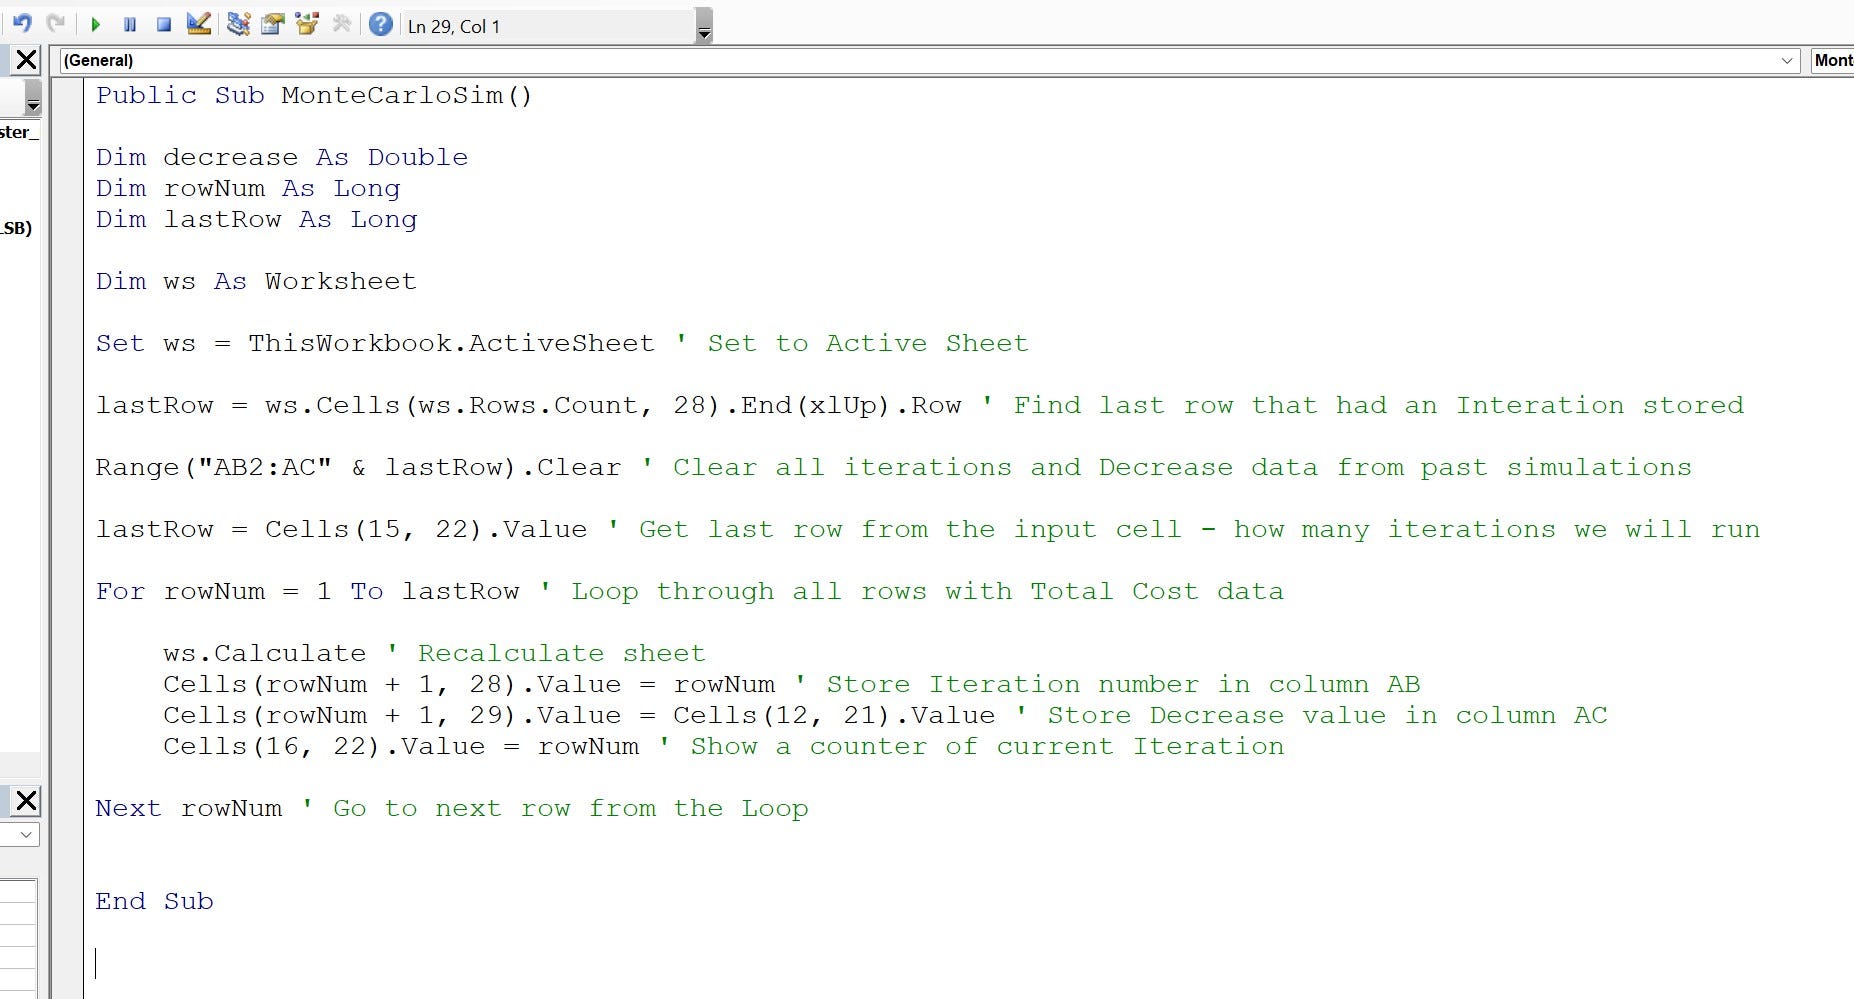
When we add the button, we will attach the following macro to it:
Public Sub MonteCarloSim()
Dim decrease As Double
Dim rowNum As Long
Dim lastRow As Long
Dim ws As Worksheet
Set ws = ThisWorkbook.ActiveSheet
lastRow = ws.Cells(ws.Rows.Count, 28).End(xlUp).Row
Range("AB2:AC" & lastRow).Clear
lastRow = Cells(15, 22).Value
For rowNum = 1 To lastRow
ws.Calculate
Cells(rowNum + 1, 28).Value = rowNum
Cells(rowNum + 1, 29).Value = Cells(12, 21).Value
Cells(16, 22).Value = rowNum
Next rowNum
End Sub
I think the comments make it pretty self-explanatory, but essentially, what we are doing is the following.
We find the last row of an iteration. We then clear the two columns for Iteration and Decrease. Keep in mind that the first run would probably clear the column headers as the lastRow will be 1 (no iterations).
We then get the last row from our input cell – this is how many iterations we will run in the following Loop cycle. Within the Loop cycle, we recalculate the sheet to get new results for our random functions (which essentially gives us different Decrease results).
Next, we store the iteration number (rowNum) and the calculated Decrease in our two Monte Carlo Simulation columns.
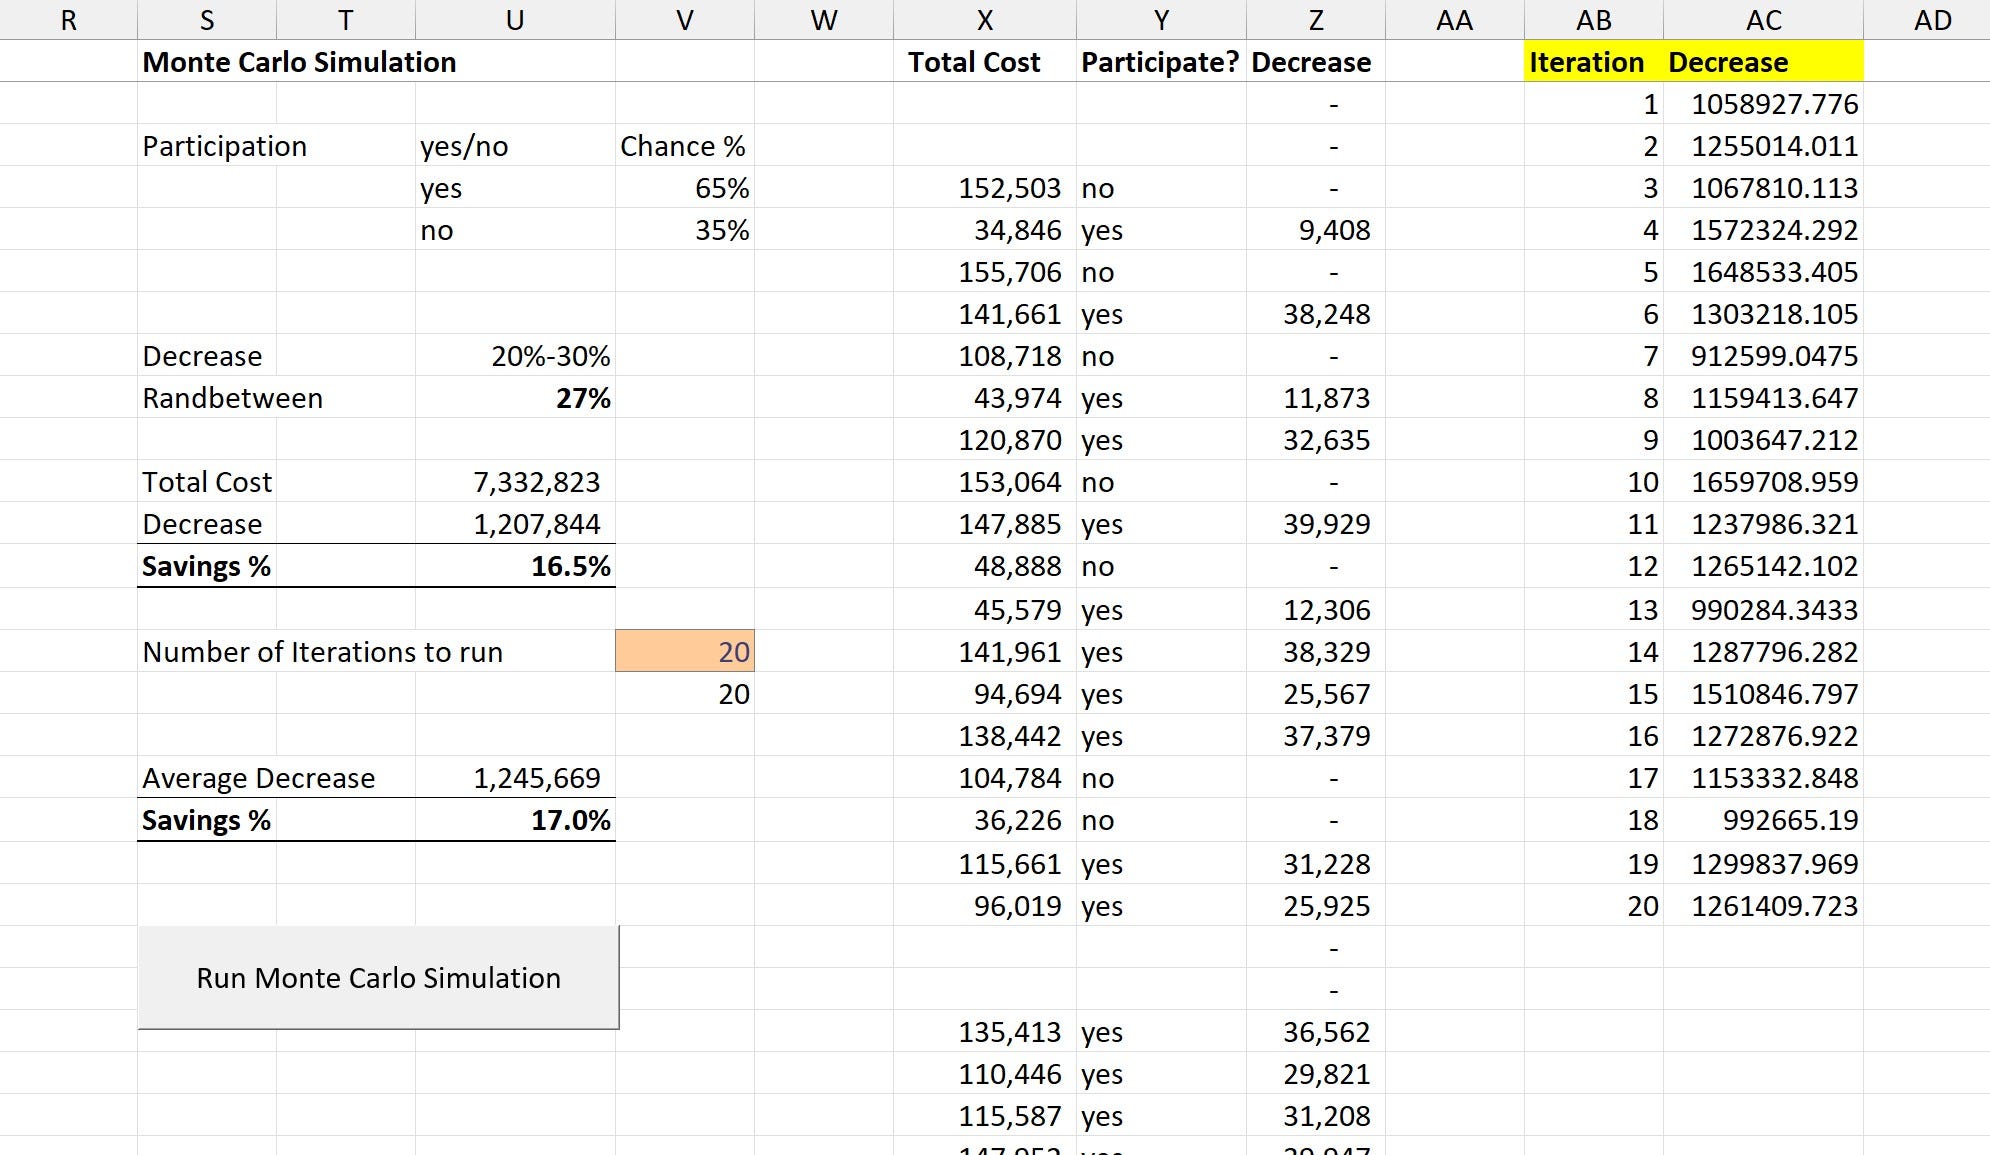
As we are adding new iterations, this changes the Average Decrease we calculated earlier.
For example, 20 iterations give us an average of 1.245m decrease, or a 17% saving.
However, running 10000 iterations brings that to 16.3% or an average decrease of 1.193m.
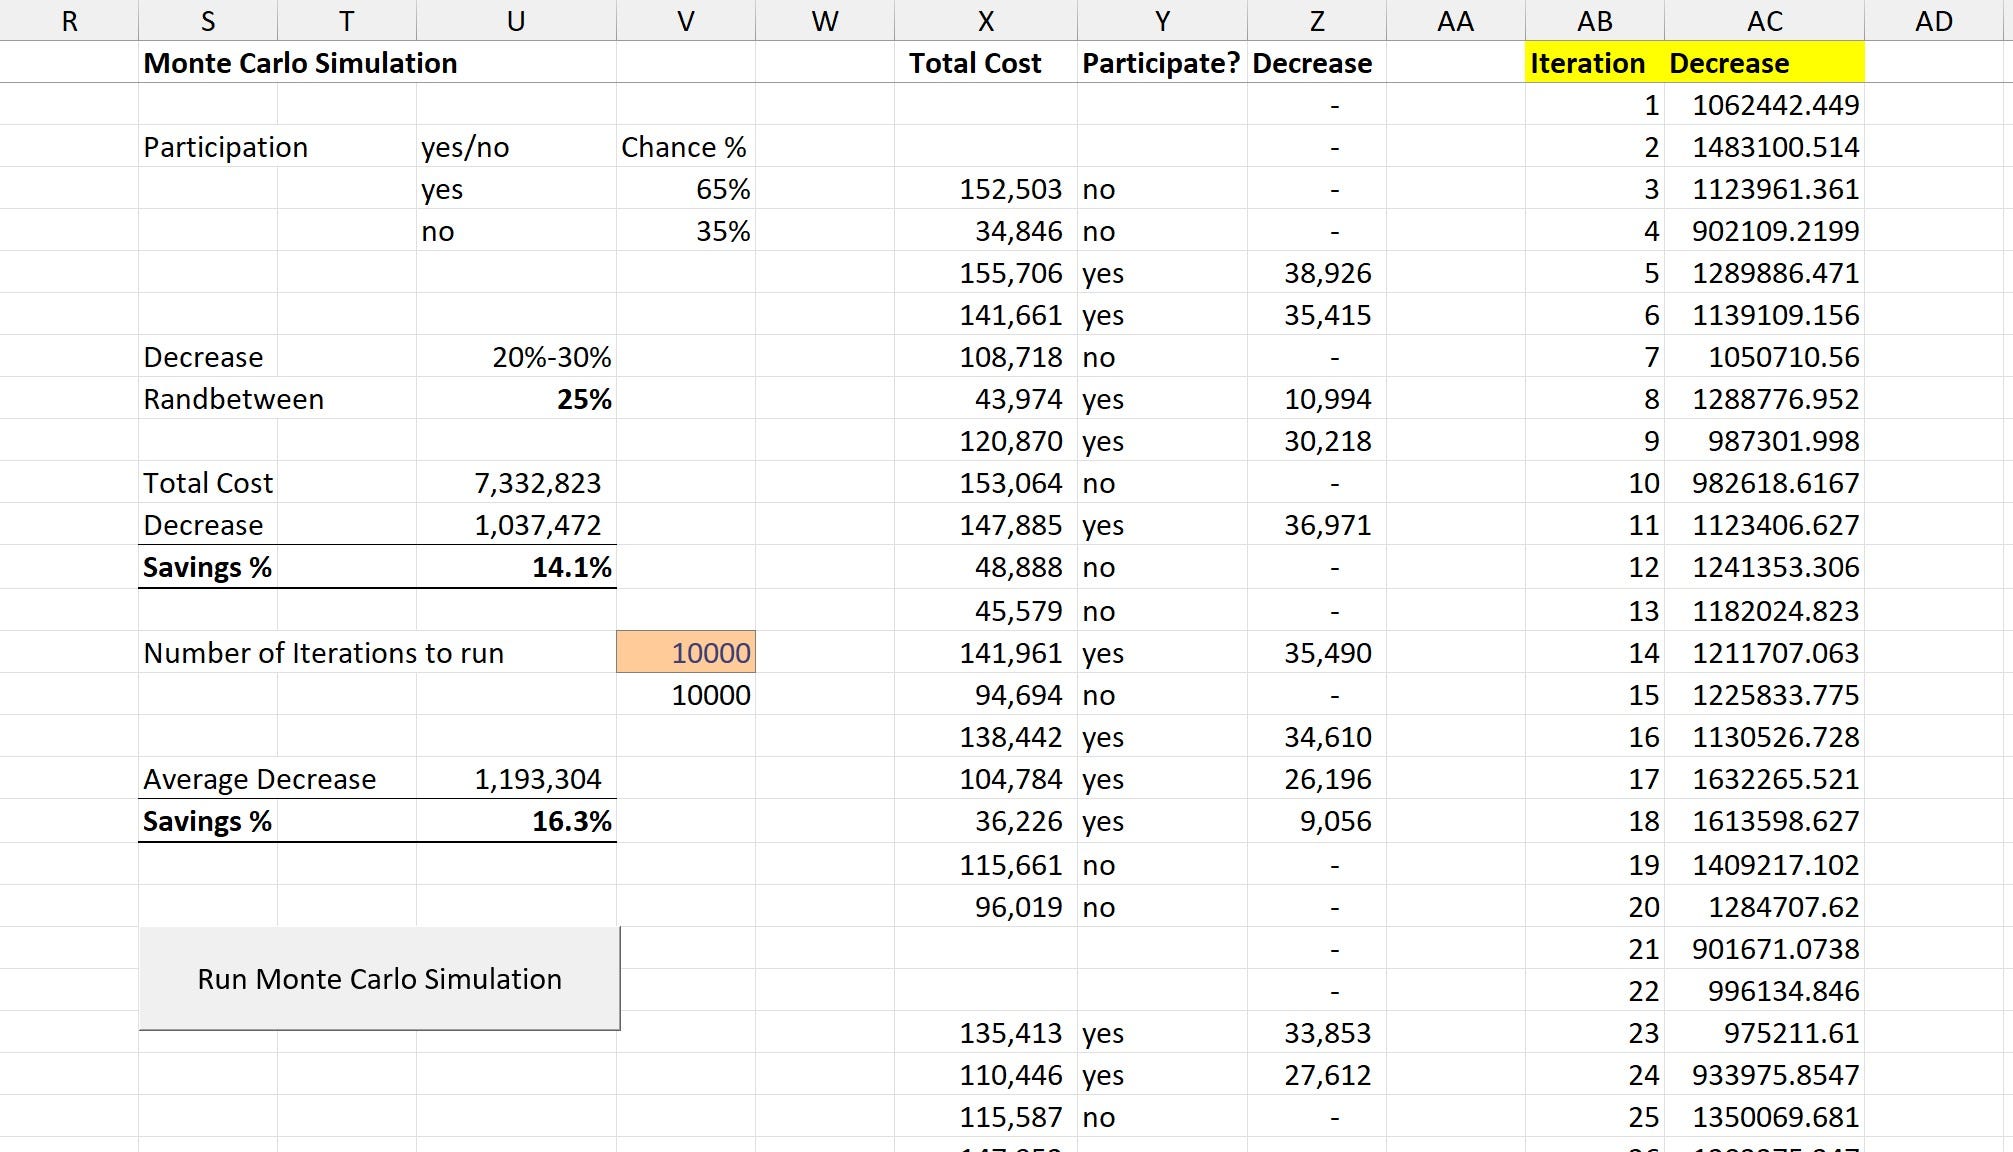
I would rarely go on to perform more than 10k iterations, as more complex model can take quite some time to run through so many iterations. However, in this simpler example, we can go a bit larger.
You see that running 100k iterations of our simulation slightly reduces our percentage to 16.2%. However, the average decrease changes from 1.193m to 1.190m, a mere 3k decrease. This proves 10k iterations were enough to estimate the potential savings we can generate given the input expectations of 65% participation for a 20%-30% decrease.
This was just a simple example, but I hope it shows you how powerful Monte Carlo simulations are. They can be very quick to setup if we keep a sample macro on hand. Granted, working with multiple assumptions and large sets of iterations can become somewhat slow on an older computer, but I believe spending 15 minutes to run 10k iterations on a complex model is extremely useful, as it helps us ground our estimates from a statistical point of view.
Wow, that was a long one! I hope it was helpful and you are now fired up to try adding Monte Carlo Simulations to your future Excel models.
Thanks for reading and for sharing the newsletter with friends and colleagues. It is the main way I grow my audience and helps me reach more people that mind find value in what I have to share.
See you next week.
Best,
Dobri 🍃